Biased Forecast
Forecasts are made using the Forecast class, which inherits from Lorenz. The time step and the number of grid points in the related Lorenz system are hard-coded to 40 and 0.05 respectively.
Forecasts are made from initial data provided by Nature at certain stations for a certain number of forecast days using a biased model. Therefore, the parameters are
Nature: Nature reference array (Lorenz.sol). Forecast quality is compared to Nature. Nature also provides initial data for the forecasts.stations: Stations are represented as grid points of the model. Forecasts are made at those grid points. Since the model is periodic, the specific distribution of stations is not important.forecast_days: The range of each forecast.forcing: The forcing for the forecast model should be different from the Nature forcing to introduce deliberate bias into the forecasts.
The method make_forecast solves the biased Lorenz model up to the forecast day for each day in the Nature run. It populates the attributes forecast and station_forecast. For each day within the Nature run, the biased model is solved for the number of forecast days and the full solution is stored in forecast. So Forecast.forecast is an array shaped like (total_days+1, 4*forecast_days+1, N). A subset of this array is stored under station_forecast corresponding to the location of the stations.
A forcing with constant and stochastics perturbations to Nature can be defined as
f_const=lambda t: (F+0.1)*np.ones(N)
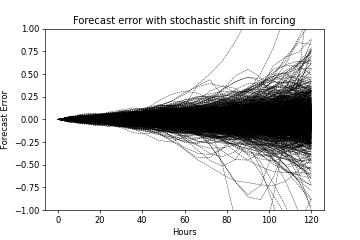
f_random=lambda t: F+np.random.normal(0,0.6,N)
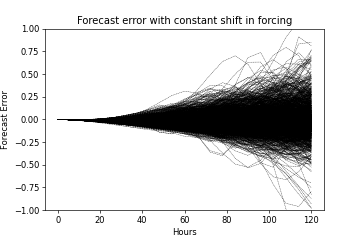
These forcings lead to the errors plotted below for the first station.


The plot takes the Nature solution and subtracts from it the biased forecast for each day of the Nature run. For example, for the constant forcing perturbation we plot
for k in range(constant.nature_days-forecast_days):
    plt.plot(constant.hours, Nature.sol[4*k:4*k+4*forecast_days+1,stations[0]]-\
             constant.station_forecast[k,:,0],'k--',lw=0.4)
 Adaptive Regression